Compressed Schedules Reshaping Point Spread Models in Basketball
Written by Jakob Bennett · Aug 4, 2026
Compressed Schedules Reshaping Point Spread Models in Basketball
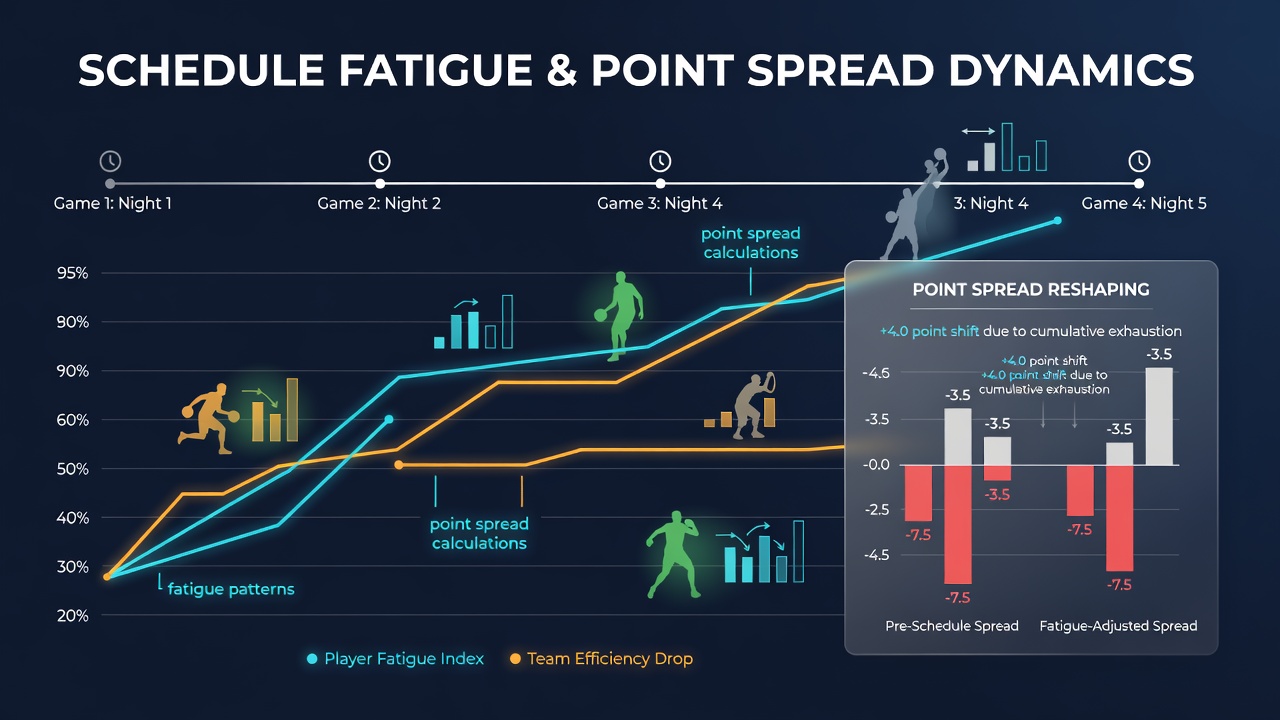
Schedule compression in professional basketball creates measurable shifts in team output that betting analysts track closely when setting point spreads for clusters of four games in five nights. Data from recent seasons shows squads operating under these constraints post reduced scoring margins in later contests, prompting oddsmakers to adjust lines by 2 to 4 points on average for the second or third game in the sequence. Researchers at academic institutions have documented how cumulative travel and recovery deficits alter both offensive efficiency and defensive rotation patterns during such stretches.
Performance Metrics Under Schedule Pressure
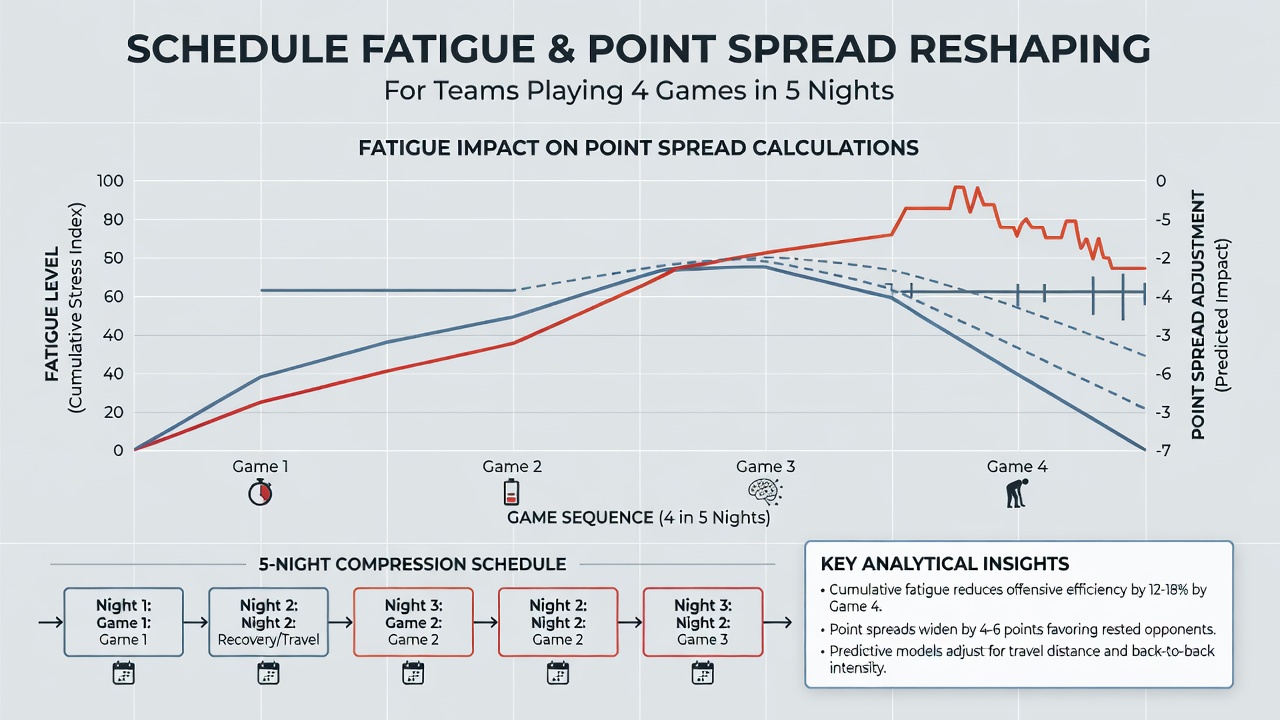
League tracking systems record drops in player movement speed and shot accuracy after multiple high-intensity nights within short windows. One analysis of 2024-2025 data revealed teams facing four games in five nights averaged 4.8 fewer points per game in the fourth contest compared with standard rest cycles. These patterns hold across multiple conferences and prompt continuous recalibration of predictive models that incorporate rest differentials as core variables. Observers note that backcourt players experience sharper declines in assist-to-turnover ratios while frontcourt units show reduced rebounding percentages on the second night of back-to-backs embedded in the cluster.
Betting Market Adjustments and Data Integration
Oddsmakers now integrate granular fatigue indicators into their algorithms rather than relying solely on season-long averages. Historical figures from the NBA indicate that home teams in the final game of a four-in-five sequence cover the spread at rates 6 to 8 percent below their season norms. This information feeds directly into live line movements and pre-game totals. Sports analytics firms compile these trends alongside injury reports and travel distances to refine projections before each slate. What's interesting is how early-season clusters produce different effects than those occurring after the All-Star break when cumulative wear compounds the issue.
According to research published in the Journal of Sports Sciences, recovery markers such as heart-rate variability and sleep duration correlate strongly with second-half defensive lapses during dense schedules. National Institutes of Health studies on elite athletes confirm these physiological responses appear consistently across North American leagues. Betting operators have responded by widening or tightening spreads based on which units log heavy minutes in prior games within the cluster.
Regional and Seasonal Variations
August 2026 preparations include expanded use of load-management protocols that teams test during summer leagues to better predict regular-season impacts. Data collected by Canadian sports medicine groups shows that cross-country travel within a four-game window amplifies fatigue effects beyond what rest days alone predict. European leagues that adopted similar condensed formats reported comparable shifts in point differential distributions, prompting parallel modeling updates among international betting platforms. These cross-regional findings help analysts distinguish between universal patterns and league-specific variables such as court dimensions or substitution rules.
Case Examples from Recent Seasons
Take one Western Conference team that played four games in five nights during March 2025. Their point spread performance shifted from covering 52 percent of games with three days rest to 38 percent during the compressed stretch. Eastern Conference counterparts displayed similar trends when facing back-to-back road games embedded in the sequence. League statisticians track these outcomes through standardized box-score adjustments that isolate schedule density from other factors like opponent strength or venue effects.
Conclusion
Point spread calculations continue evolving as more granular data on schedule fatigue becomes available to both teams and markets. Patterns observed across multiple seasons demonstrate consistent directional impacts that models now quantify with increasing precision. Those who study these dynamics recognize that ongoing refinements in tracking technology and recovery science will further shape how lines respond to clusters of four games in five nights.