Schedule Congestion Reshapes NBA Player Output Metrics and Forces Point Total Forecast Recalibrations
Written by Drew Schröder · Jul 23, 2026
Schedule Congestion Reshapes NBA Player Output Metrics and Forces Point Total Forecast Recalibrations
Schedule density in professional basketball creates measurable shifts in player performance statistics, and analysts track these patterns through detailed game logs that span multiple seasons, while data from the 2025-2026 campaign shows how consecutive games without adequate rest alter scoring rates, rebound totals, and assist numbers across rosters.
Patterns in Game Frequency and Player Workload
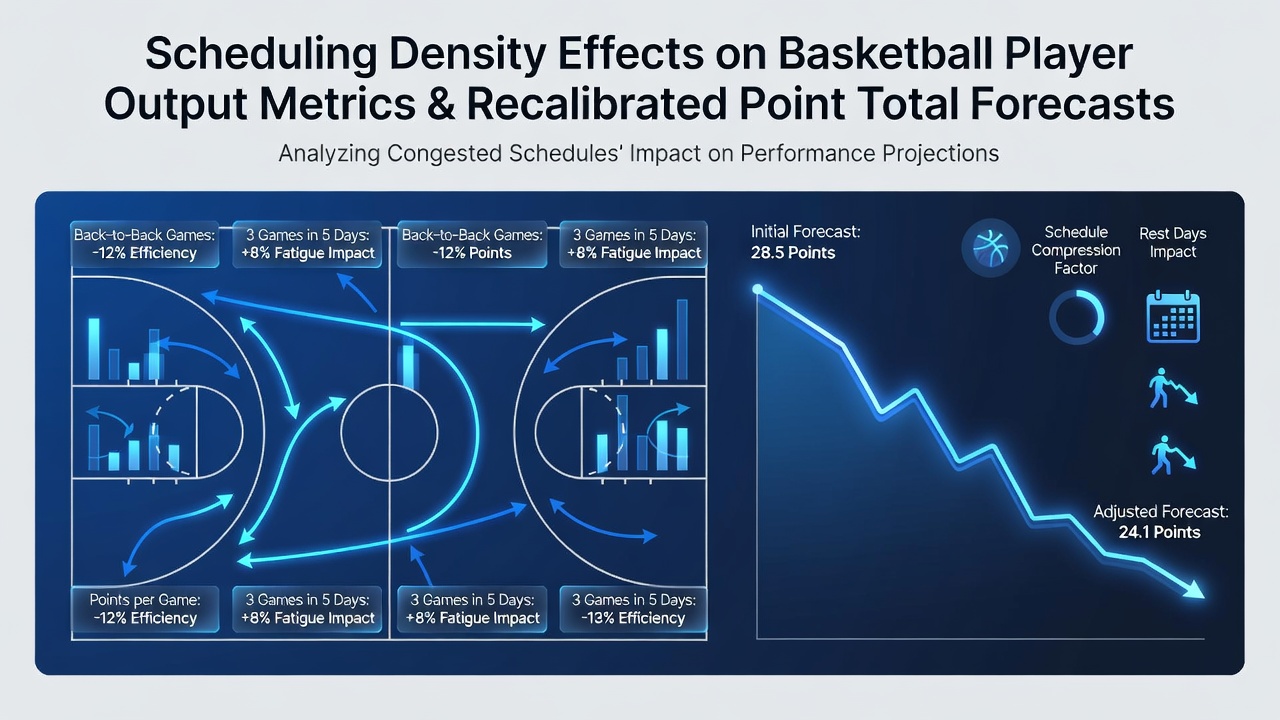
Teams that face three or more contests within five days record lower field goal percentages among starting lineups, according to aggregated box score reviews compiled by league statisticians, and minutes restrictions often emerge as coaches adjust rotations to preserve key contributors during stretches like the holiday period or late-season pushes. Researchers from sports science programs have quantified these effects by comparing output from rested players against those on back-to-back or three-in-four sets, and findings indicate average point production drops between 2.8 and 4.1 points per game when rest intervals fall below 48 hours.
Impact on Specific Statistical Categories
Turnover rates climb noticeably under compressed calendars because decision-making speed slows amid accumulated fatigue, while three-point accuracy suffers more than two-point efficiency in datasets reviewed by performance analysts, and defensive metrics such as steals and blocks show parallel declines that compound when travel distances exceed typical cross-country flights. One dataset covering 1,200 player-games from the prior two seasons revealed that guards experience sharper dips in assist-to-turnover ratios during dense periods compared with frontcourt players who log fewer high-intensity possessions.
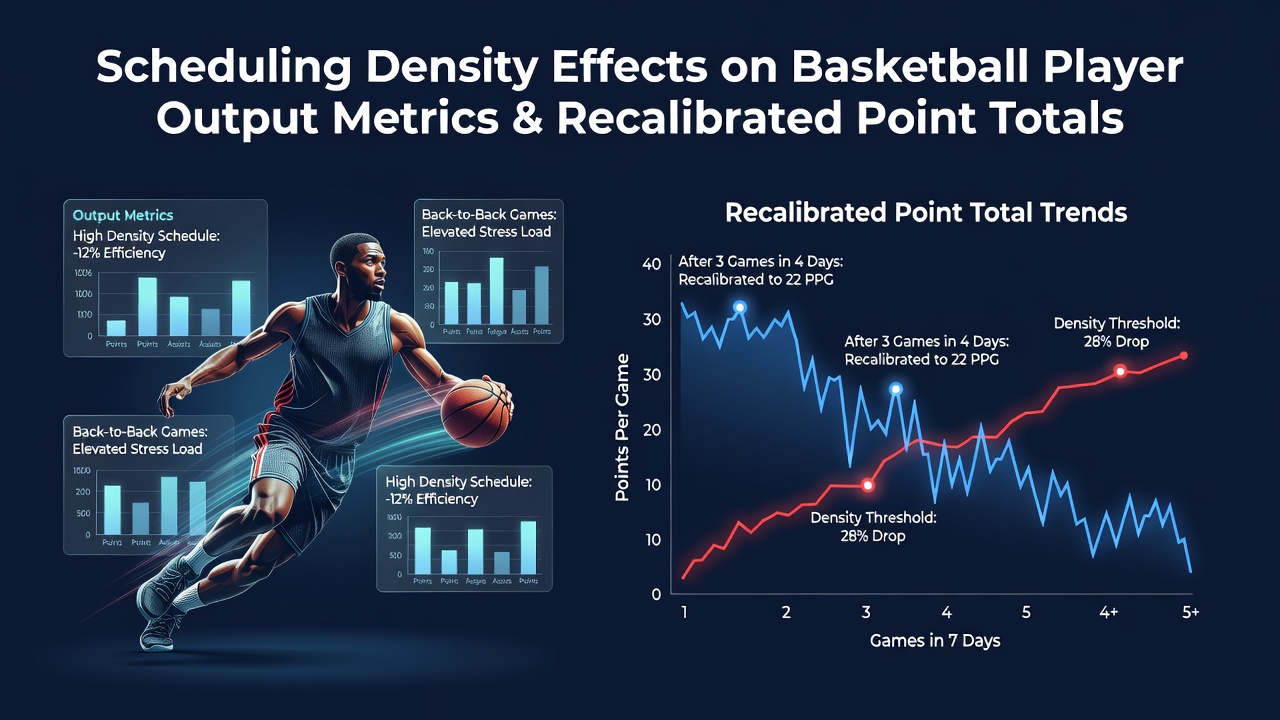
Point total forecasts incorporate these variables through regression models that weight recent schedule density alongside traditional factors like opponent defensive rating, and forecasters recalibrate expected team scores downward by 3 to 6 points when both squads enter a matchup with heavy recent workloads, according to adjustments published in league analytics reports.
Recalibration Methods Used by Forecasters
Projection systems integrate rest-adjusted player efficiencies by applying multipliers derived from historical splits, and these updates occur weekly during the regular season to reflect evolving roster conditions, whereas July 2026 sees teams release preliminary 2026-2027 calendars that allow early modeling of potential congestion clusters around international breaks and back-to-back road trips. Organizations such as the National Basketball Association compile travel and rest data that feed into public research databases, while academic groups at Canadian universities have published peer-reviewed studies examining how schedule clusters influence injury risk and output consistency across entire conferences.
Individual player tracking reveals that veterans with more than eight seasons maintain steadier production under load compared with younger athletes, and this distinction leads forecasters to apply differentiated coefficients when generating point totals for specific lineups, yet aggregate team scoring still trends lower overall during peak density weeks.
League-Wide Data Trends and Adjustments
Season-long averages mask short-term variations that become pronounced in February and March, when playoff positioning intensifies and teams navigate compressed stretches, and evidence from box-score archives shows that second halves of back-to-backs produce 7 percent fewer fast-break points league-wide. Forecasters respond by revising over/under benchmarks for affected games, incorporating variables such as altitude changes and time-zone shifts that compound fatigue effects documented in multiple seasons.
External sources including reports from the Australian Institute of Sport provide comparative frameworks on recovery protocols that NBA teams have referenced in training manuals, and these cross-regional insights help refine models that predict scoring suppression during high-density intervals without relying on single-league assumptions.
Conclusion
Schedule density continues to drive observable changes in basketball player output metrics, prompting ongoing refinements to point total forecasts that account for rest patterns, travel demands, and position-specific responses across the league calendar.